Use execution evidence instead of guessing
Understand what your script did
When an automation behaves unexpectedly, inspect the evidence that answers your question. Run Logs explain command activity and timing; a correctly timed screenshot shows the screen itself. Use the two focused guides together without confusing a saved image with the live app.
Choose execution or screen evidence
The prepared Recover script contains a Restored / Done PromptMe and five short Delay commands. This unchanged video runs it once in Normal mode, inspects that exact record, and restores the original Verbose preference without clearing history. Use the Run Logs steps below.
Inspect the screen you actually saved
This guide makes one manual Home capture and inspects it without creating an asset, cropping or deleting an image. For evidence from playback, use a Screenshot command at the relevant point instead. Follow the screenshot steps or read this narration.
Follow the diagnostic workflow
Choose the detail you need before Play
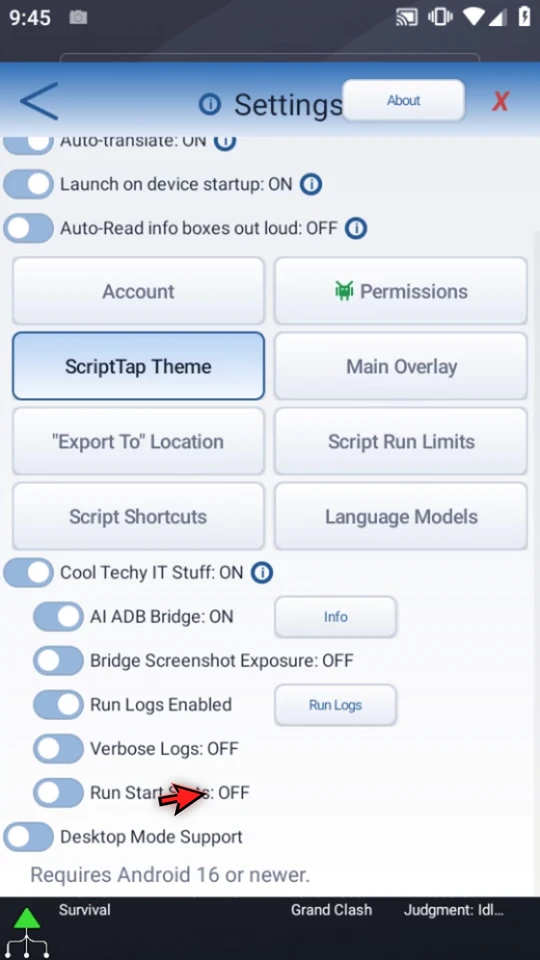
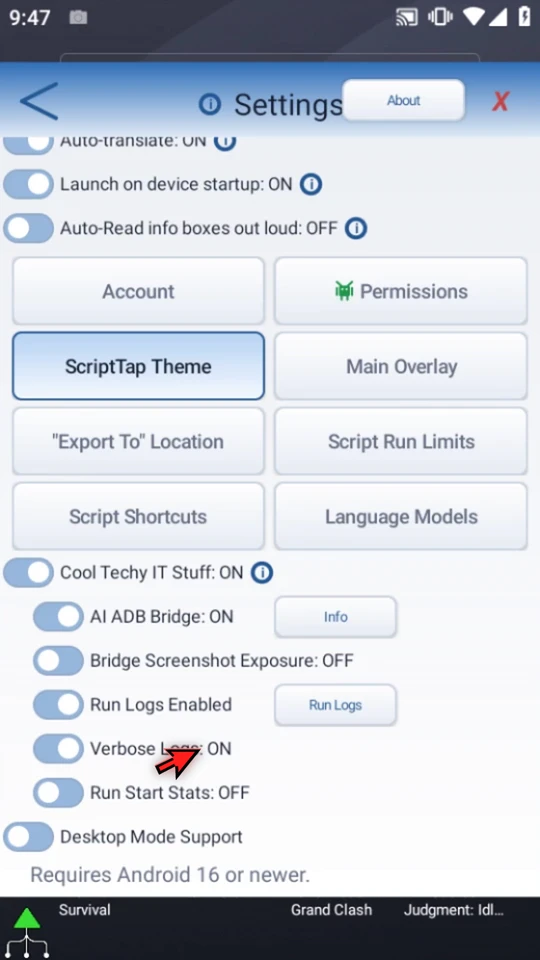
Open Main Overlay's menu, choose Settings, and find Cool Techy IT Stuff. Keep Run Logs Enabled for the run you want to inspect. Verbose Logs OFF selects the compact Normal detail mode used here; ON adds detailed variable-write logging. Run Start Stats is a separate startup-diagnostics option, left OFF in the example.
Turning the logging master OFF stops new log creation, not script playback or access to retained history through an eligible viewer. The child detail/startup switches appear while the master is ON; turning the master OFF also clears Run Start Stats.
Run a small test with a visible result
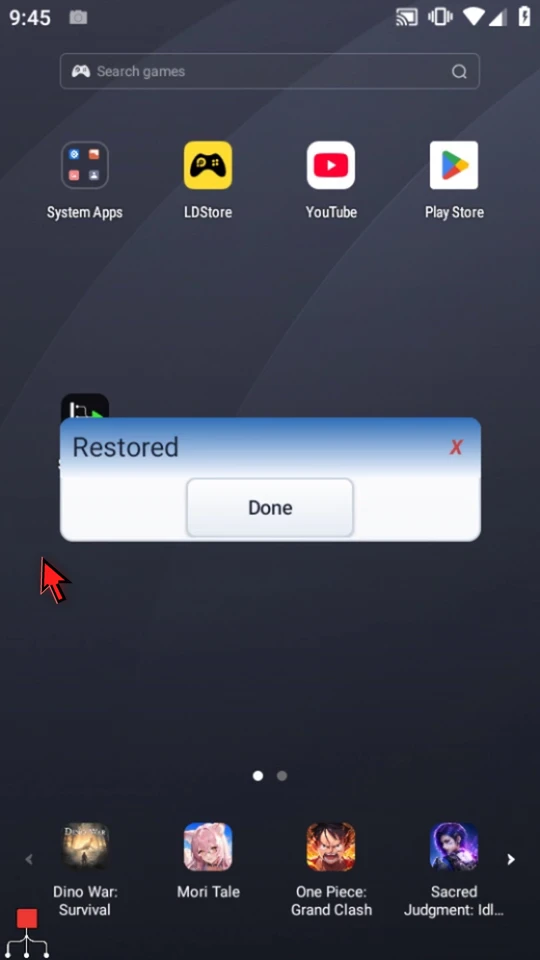
Close Settings and use Play. The prepared script displays Restored. Choose Done; the remaining short waits finish naturally. A small test keeps the evidence easier to interpret than a large production workflow.
The recorded duration includes time waiting for the person's response. Unchanged waiting frames are shortened in the tutorial; this is not a performance benchmark.
Open the correct run and compare counts
Return to Settings → Run Logs. Runs are newest first. Check the script name, start time, status and detail mode before interpreting a record. Clear removes stored history, so do not press it while gathering evidence.
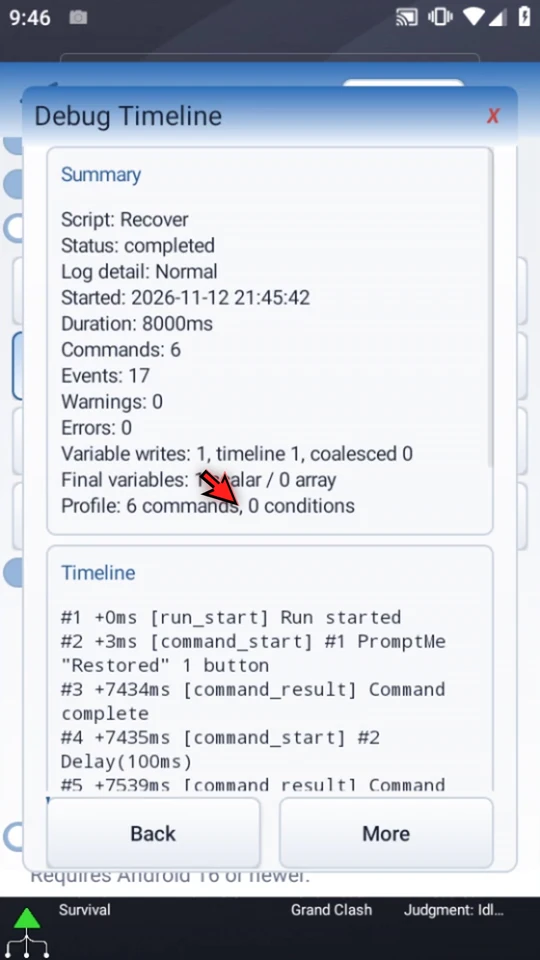
Commands is the captured script count: 6 here. Profile reports actual executed commands: also 6 in this simple example. Loops, Calls and early stops can make the counts differ. Older records without a trustworthy captured count show it as unavailable, not an invented zero. Warnings, errors and final-variable counts provide further context; they do not establish that every external app action achieved its goal.
Follow events through completion
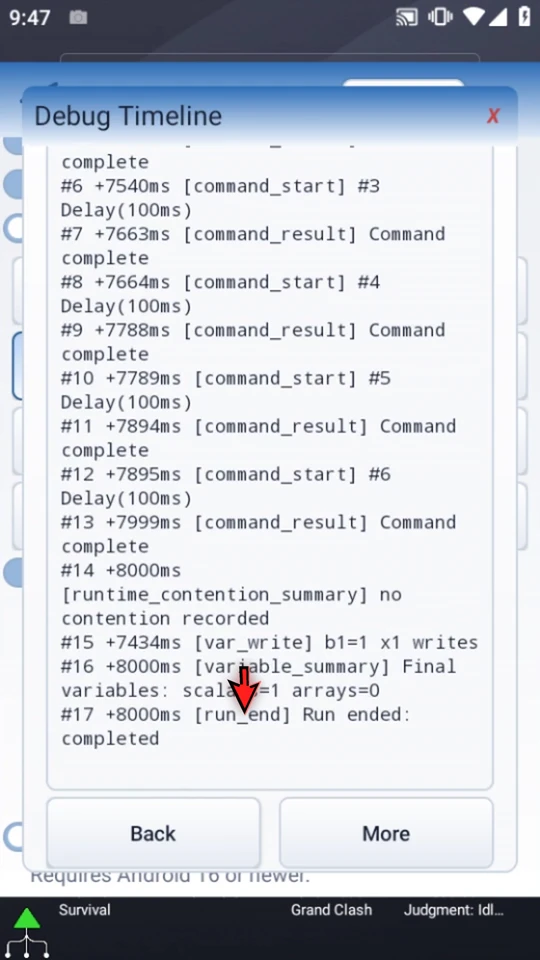
Scroll through the loaded timeline to follow command starts, results and elapsed offsets. In this run, each of the six commands completes, the compact variable-write entry records the Done-button output, and run_end reports completed. More loads another event page only when one is available; scrolling is not the same as requesting more events. Back returns to the list.
Normal mode may still contain compact variable-write entries, as this short example does. It does not mean that all variable events are absent. History is bounded to the newest 20 runs, and each run has a 10,000-event limit; do not treat it as an unlimited permanent archive.
Change future detail deliberately
Close history and select Verbose Logs ON when detailed variable logging will help answer a specific question. This changes later runs, not the Normal record already inspected. The tutorial restores its original ON preference and leaves the logging master ON and Run Start Stats OFF.
Completed is not the whole answer
A completed run means execution reached its normal end. It is not proof that a tap hit the expected changing screen, that an app accepted a request, or that a recognition target remained in place. Read command results and warnings in context, then test the intended outcome in the target app.
Logs are diagnostic evidence, not a substitute for configuration validation or a carefully observed test. A screenshot and a log answer different questions.
Add visual evidence at the right moment
Watch the saved-screenshot guide. For evidence from inside playback, put a Screenshot command at the relevant point in your script. A manual Main Overlay screenshot captures the current screen instead; a picture taken afterward cannot prove what was visible earlier.
Capture a neutral screen
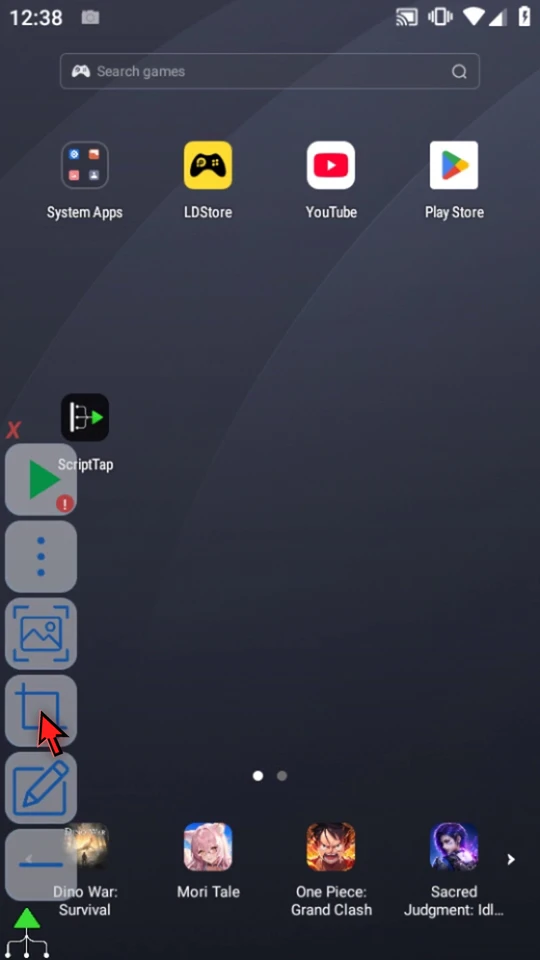
Expand Main Overlay and choose Screenshot. If Android asks, allow screen capture. Wait for the real capture to finish. The new Crop helper is a shortcut to asset creation; leave it alone when you only want diagnostic evidence.
Open the source gallery without browsing folders
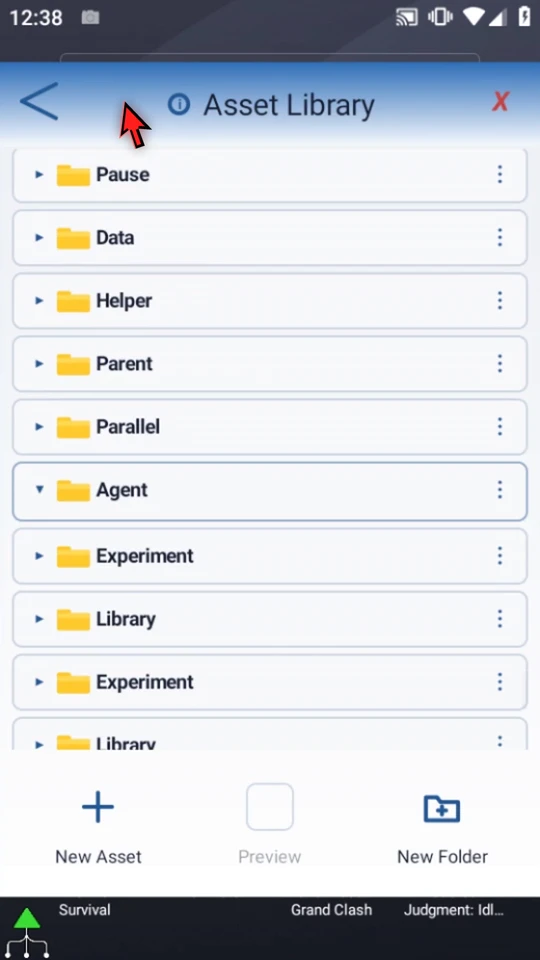
Open Main Overlay's menu → Scripts, fold idle controls, then use Assets in the header. Choose New Asset at the bottom. This opens Recent Screenshots; it does not create an asset yet. The gallery's header screenshot button can request another capture, but the example uses the one already saved.
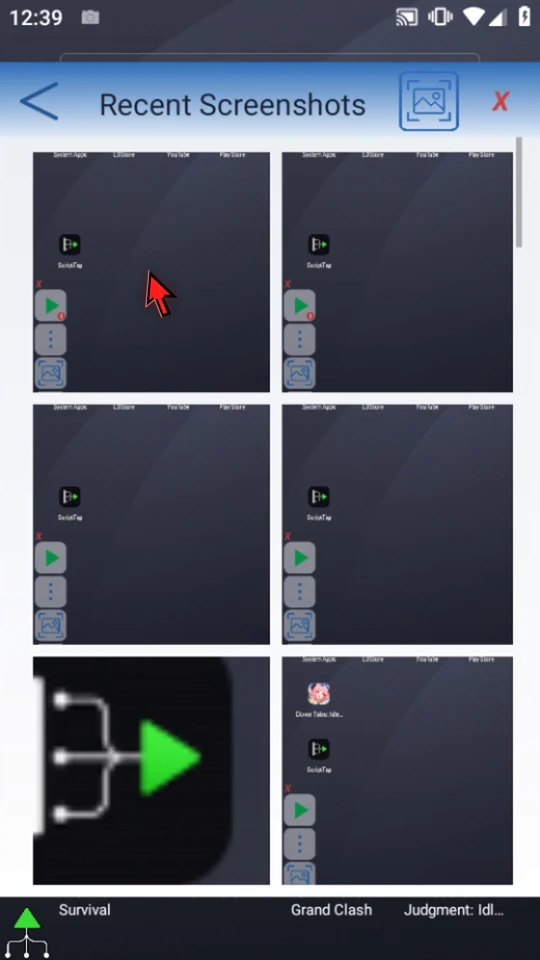
Choose inspection, not creation or deletion
Select the newest neutral image. View opens the saved pixels. Create Asset starts a separate asset workflow, explained in Asset Creation. Delete removes the selected saved screenshot. The video chooses View and preserves the image.
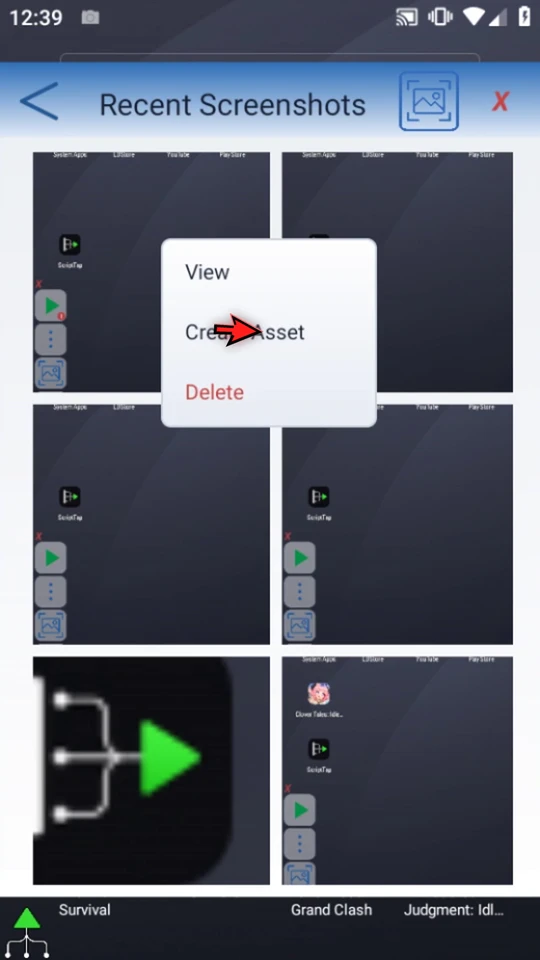
Read the image as evidence
Compare the captured target and its surroundings with what the workflow expected at capture time. Pictured app buttons and pictured overlay controls are saved pixels, not live controls. In this example the image retains its capture time, even while the device clock continues.
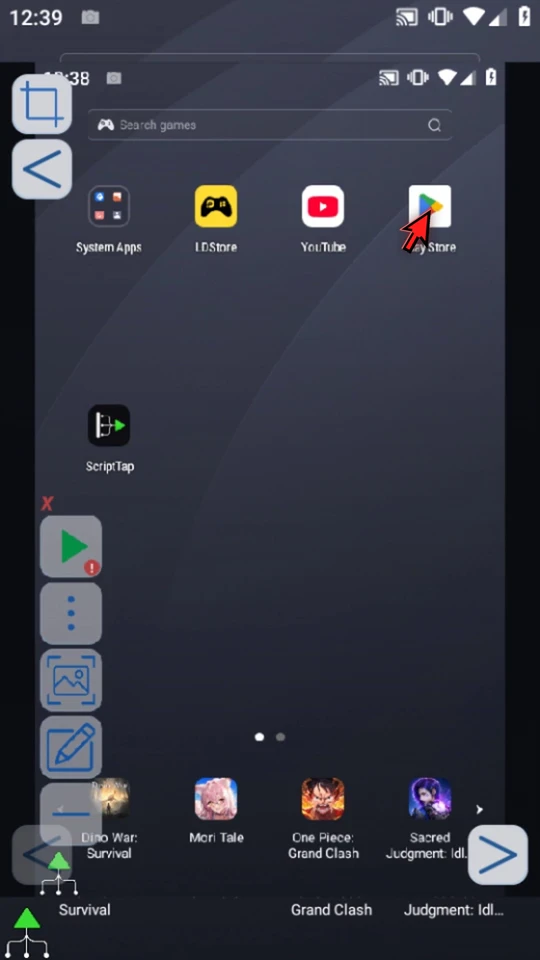
Distinguish the viewer's real controls
The viewer has its own Crop and Back controls, separate from the picture. Bottom arrows browse saved images. Crop begins asset creation; this guide uses neither Crop nor the arrows. Use viewer Back to return, then the gallery X to close. Review images and diagnostic text for private information before sharing.
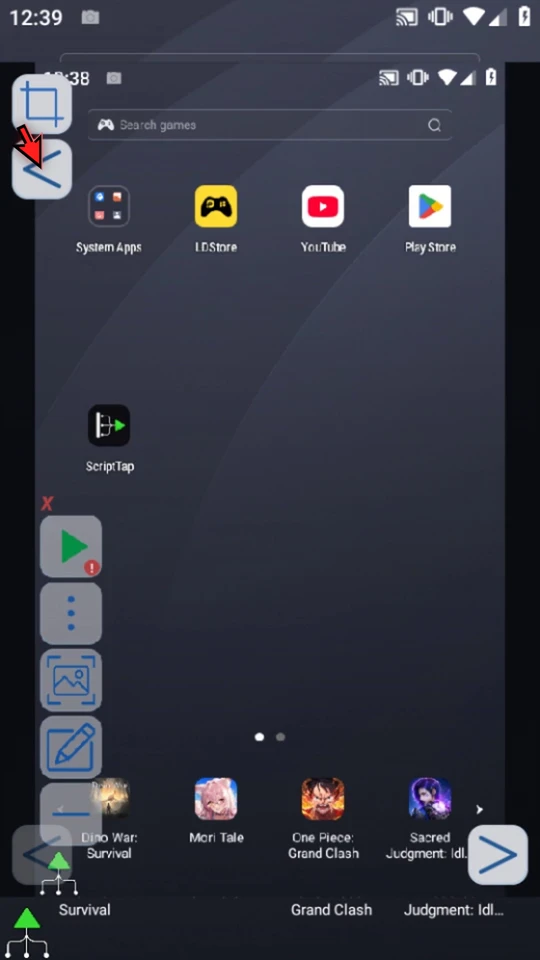
The video preserves capture, gallery and viewer transitions. Only visually unchanged waiting is shortened; the image is a real saved screenshot, not a recreated example.
Choose the next useful check
Read the full narration
When a script behaves unexpectedly, check what it actually did. Run Logs show command activity and timing; a saved screenshot helps you inspect the screen itself. Our prepared example has one confirmation prompt followed by five short delays.
Close the editor, open the main overlay menu, and choose Settings. Find Cool Techy IT Stuff and Run Logs. The on-device Run Logs viewer is currently available to approved test accounts. Keep Run Logs enabled before the run you want to inspect.
Verbose adds detailed variable-write events. Turn it off for this Normal-mode example, which keeps the timeline more compact. Run Start Stats is a separate option for investigating script startup; we will leave it off. Disabling Run Logs stops new recording, not playback or existing history.
Close Settings. When the script is complete, simply use the Play button in the main overlay. The Restored prompt appears. Choose Done; after the remaining short delays, the script stops automatically.
Open Settings again and choose Run Logs. The newest runs appear first. Clear removes stored history, so leave it alone while investigating a problem.
Select the run you just completed. Check its script name, start time, status, and log detail mode so you do not mistake an older run for your latest test.
Commands is the captured script count: six here. Profile reports actual executed commands, also six in this simple run. Loops, calls, or an early stop can make those counts differ. Review warnings, errors, and final-variable counts, not just completed status.
Scroll through the timeline to follow command starts, results, and elapsed offsets. The end confirms how the run finished. More loads another event page when one is available; scrolling only moves through events already loaded. Back returns to the run list.
Close the history and turn Verbose back on to show where detailed variable logging is selected. That changes future runs; it does not rewrite the Normal record we just inspected. Use detailed logs only when they help answer your question.
Read the saved-screenshot narration
A log does not show every pixel the device saw. Use a Screenshot command at the relevant point for evidence from script playback; its separate command guide explains setup. For a quick manual check, we will capture the current Home screen instead.
Expand the main overlay and choose Screenshot. If Android asks, allow screen capture. The new Crop button is a shortcut for creating an asset; we do not need to crop this diagnostic image.
Open the menu and choose Scripts. Fold the floating controls if they get in the way, then choose Assets in the header. There is no need to browse through your script folders just to inspect a saved screenshot.
Choose New Asset to open Recent Screenshots. This opens the image source gallery; you have not created an asset yet. The screenshot button in this header can request another capture. For this example, use the neutral Home screenshot we just saved.
Select the newest neutral screenshot. Its menu offers View, Create Asset, and Delete. Create Asset starts the asset workflow; Delete removes the saved screenshot. We will choose View and keep the image.
These are saved pixels, not live app buttons. Compare the captured target and its surroundings with what your workflow expects. A screenshot taken afterward cannot prove what was visible earlier in the run.
The viewer has its own Crop and Back controls, separate from the captured picture. The bottom arrows browse saved images. Crop starts an asset-creation workflow; the Asset Creation guide explains that process. Here, we are only inspecting the image.
Return from the viewer and close the gallery. Use logs for execution evidence and correctly timed screenshots for visual evidence. Review both before sharing: screen images and diagnostic text can contain private information.